Did You Know?
V23+ in Power UX offers pivot tables for the Executive Dashboard and the Cost Analysis Detail part of the Project Dashboard. These tools can be used to summarize and reorganize selected columns and rows of your project accounting data.
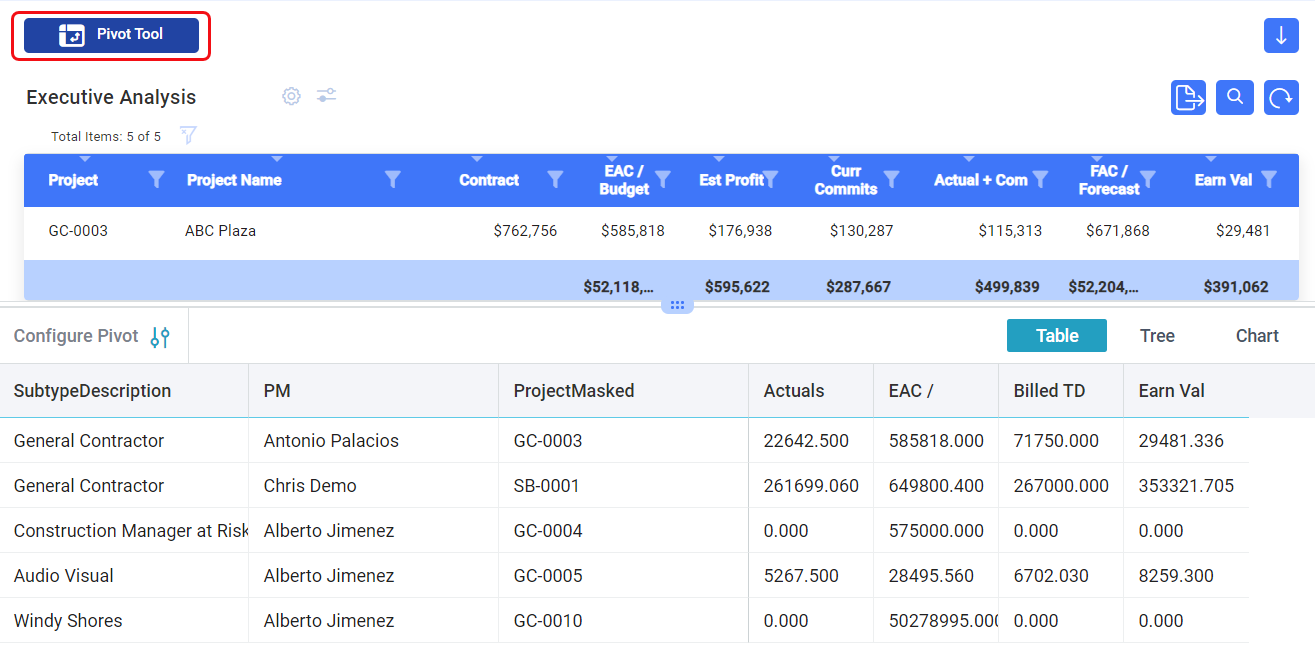
Executive Dashboard:
When you click on the Pivot Tool button on top, data from your projects appear in the bottom section of the dashboard in a default layout.
- You can choose to Configure Pivot by clicking that option. A side panel will open where you can add or subtract rows and columns, specify values and filters, and change table options. (Scroll in the side panel to get to all the options.)
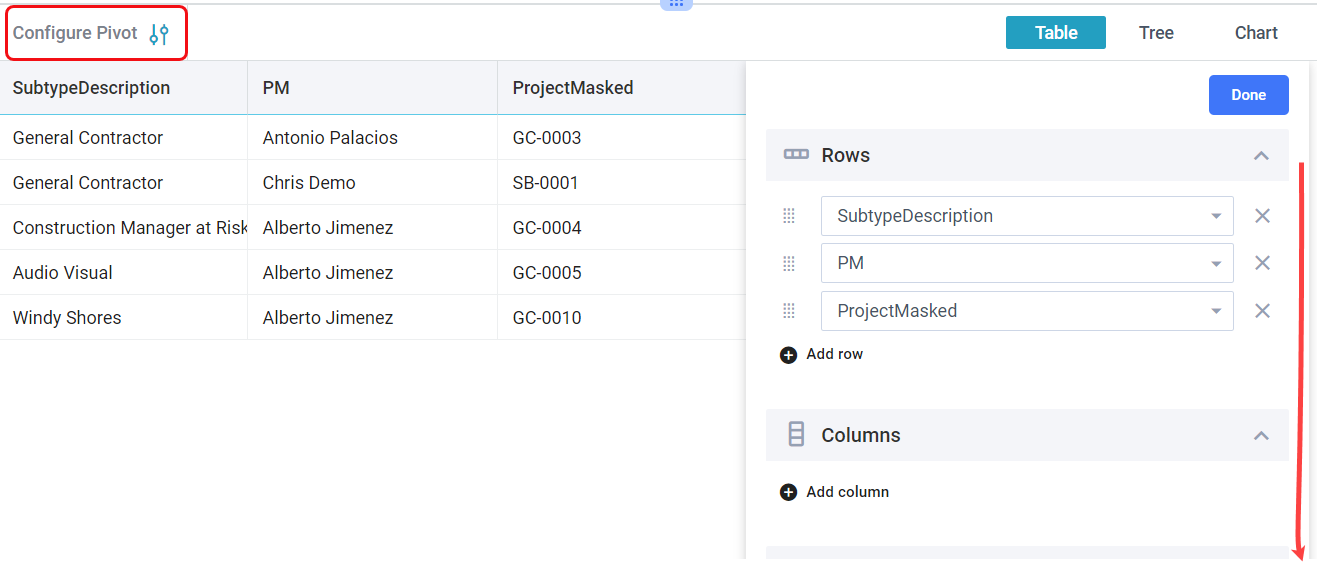
- Click the Done button to get back to your pivot data with your new settings. Your new settings will be saved as your new default staring layout.
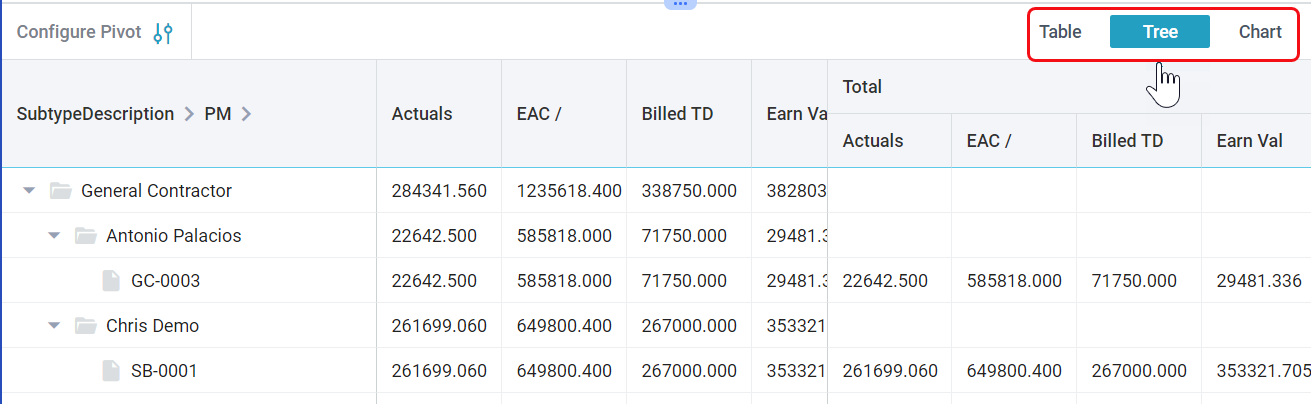
- The data can be presented in three views: Table, Tree and Chart. Click on the view desired.
- To get out of the tool, click on the Pivot Tool button at the top again.
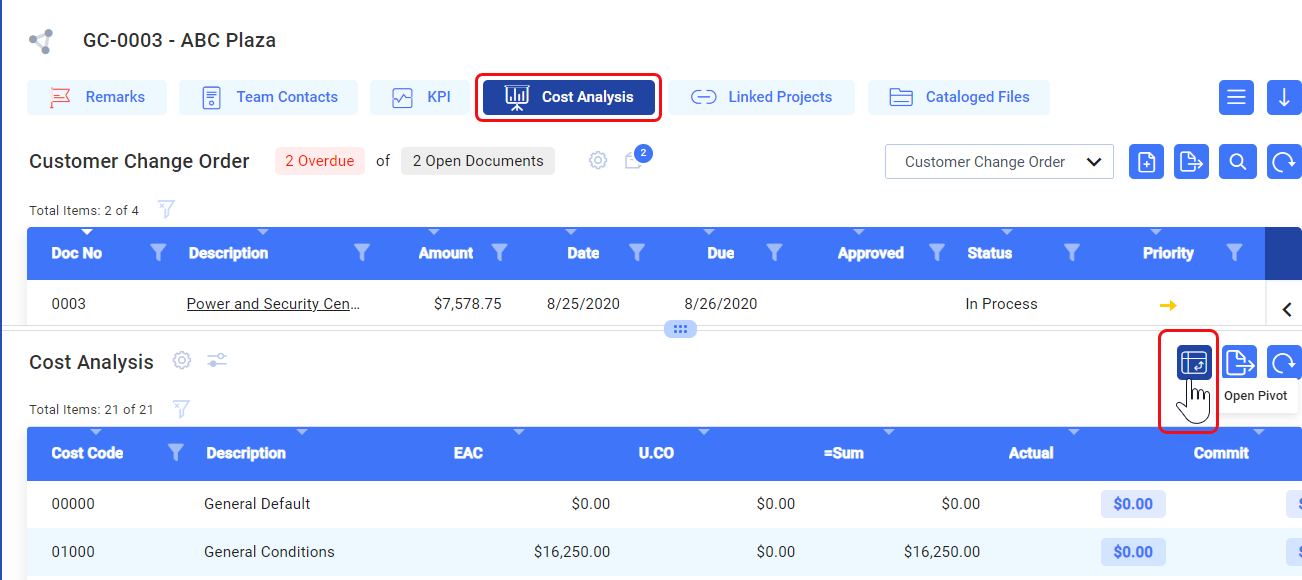
Cost Analysis Detail
The Pivot Tool works in the same manner for the Cost Analysis Detail part of the Project Dashboard. However, the button to open the Pivot Tool is found on the right side.
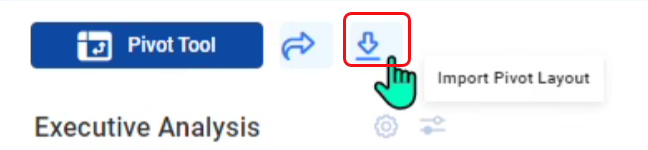
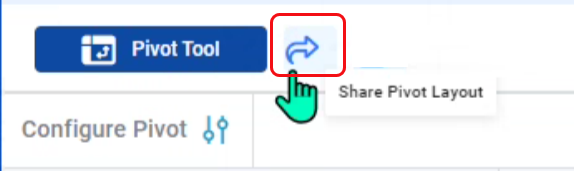
Sharing Your Pivot Tool Setup
The Pivot Tools allow you to share your layout settings.
- Click the Share button to open an email with a link. Tip: share with yourself to copy your settings to another device (laptop, tablet, etc.).
- Click the Import button to import the layout via the link emailed to you. A dialog box will allow you to paste the string from the email.