Question:
What’s the fastest way to grab project cost analysis data for reporting?
Answer:
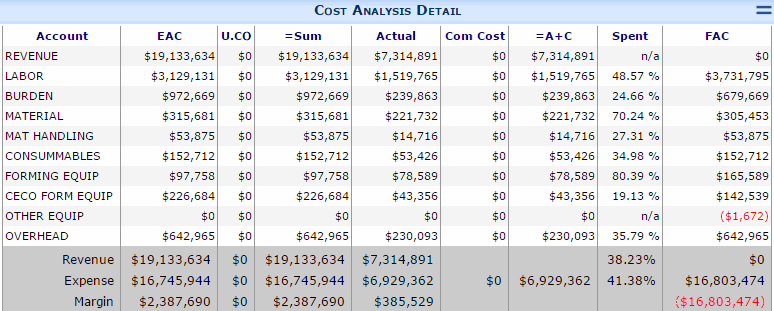
Project Cost Analysis data includes amounts from the budget, actual, committed and forecast costs and revenue. Approximately 60 data points are available for each line in the project’s work breakdown.
This data can always be recalculated from its component transactional data, but doing so for many projects can take a noticeable amount of time. Moreover, as projects age or are completely closed, you may still want them in reports, yet their cost summaries are relatively static.
Where’s the Summary Data?
The summary data is stored in the table dbo.xsfProjectCASummaryData. This table contains a row for every project task and account that has been budgeted, committed, or had an actual amount recorded. Simple aggregation allows these rows to be summarized very quickly by account, cost code or even project. You can define a Local Table in your report query:
DECLARE @CA as dbo.ProjectCASummaryTable
Assuring the Data is Current
The simplest way to make sure that the summary data is current is
EXEC dbo.psf_ProjectCASummaryRefresh ‘%’
This stored procedure takes a project mask, but defaults to all projects. When run, the refresh uses dbo.ProjectCASummary to check if any existing summaries have gone stale and recalculates any that require updating (based on the mask). You can also use dbo.ProjectCASummary directly. It allows far greater selectivity in which projects will get calculated; however, it is harder to use. In either case, the actual time required will depend on the number of projects that have changed recently. If you want to check for stale data without recalculating anything automatically, use
EXEC dbo.pu_ExpireProjectCASummaryData
Using a Project List
If you choose to use a combination of the summary data and your own data gathering, it will be important to create a list of projects first. Use something like
DECLARE @ProjectList AS dbo.ProjectIDListTable
and
INSERT INTO @ProjectList SELECT Project FROM dbo.f_ProjectList( ‘your-mask%’,1 )
Then select data from the summary into your report result table
INSERT INTO @ReportData
SELECT sd.Project, sd.Task, sd.Acct
, …..
FROM dbo.xsfProjectCASummaryData sd
WHERE sd.Project in (SELECT pl.Project FROM @ProjectList)
— OPTIONALLY GROUP BY (project or task or acct or nothing…)
Then remove the ‘satisfied’ projects from your Project List
DELETE FROM @ProjectList WHERE PROJECT IN (SELECT DISTINCT sd.PROJECT FROM @ReportData sd)
Finally, limit your custom data gathering to WHERE the project remains in the Project List!
Additional Comments:
Spitfire’s reports, the Executive Dashboard, and the Project Dashboard Cost Analysis part all use this summary data when it is available or recalculate and update the stored summary. Stale data is never returned!
See:
- psf_ProjectCASummary – Master generator of CA Summary Data
- psf_ProjectCAData – CA Data for a single project
- psf_ProjectLineSummary – CA Data aggregated to one line per project
- f_ProjectList – returns a list of projects, optionally including project children
KBA-01609; Last updated: September 19, 2017 at 12:54 pm;
Keywords: CA Summary

