
Question:
How do I get and send logs from my Chrome browser?
How do I get and send logs from my Edge browser?
Answer:
To get a log, you typically want something you can reproduce on demand.
Here is one way:
- If at all possible, open a new Project Dashboard or Document in Spitfire. That will create a new tab on your browser.
- Right-mouse-click on any white space and choose “Inspect” (CTRL+SHIFT+I).
- With the Chromium Devtools open, select Console (across the top). If there are existing lines, clear them by clicking the “clear” icon.
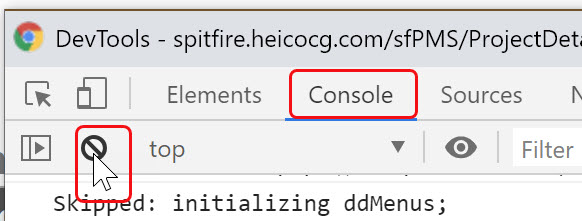
- Go back to your Spitfire tab, go to the end of the address bar (on top) and hit ENTER. This is *not* the same as the refresh button; this does a full page reload, this time with Chromium DevTools open.
- Reproduce your symptom.
- Find the DevTools Console again. (You can repeat CTRL+SHIFT+I if necessary to bring it to the foreground.)
- Right mouse-click on any line in the Console output and choose Save As.
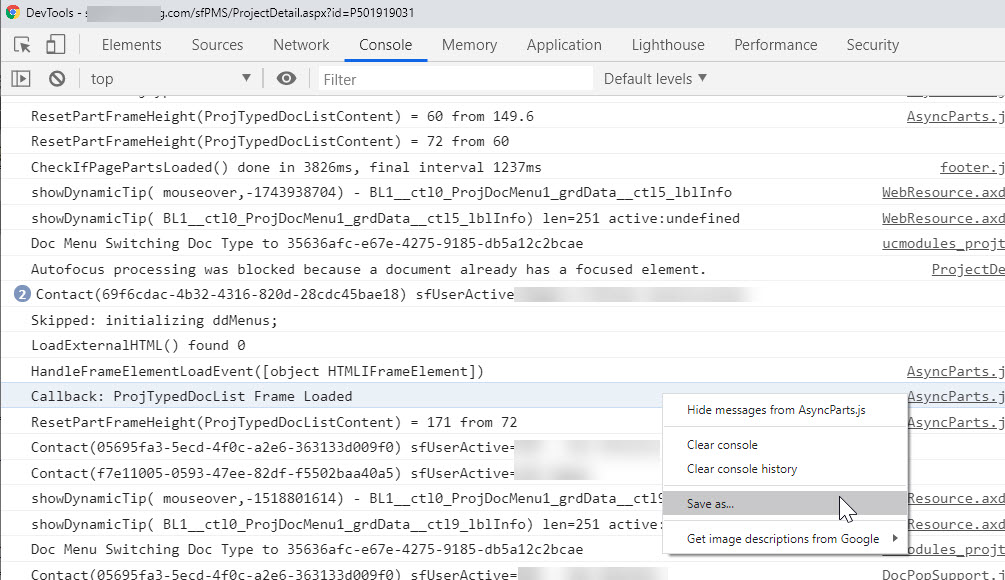
Chromium Console Context Menu
- Ideally, name the file with your case number. The log file will be saved in the user’s Downloads folder by default
- Send the log file to support.
KBA-01799; Last updated: May 26, 2022 at 17:22 pm